Necessary Always Active
Necessary cookies are required to enable the basic features of this site, such as providing secure log-in or adjusting your consent preferences. These cookies do not store any personally identifiable data.
|
||||||
|
||||||
|
||||||
|

With its proven track record in the field of tech, Microsoft launched its compelling analytics tool—Microsoft Power BI. Since its release, the tool has been helping enterprises to visualize and analyze their enterprise data easily for transform their operations.
Business Intelligence or BI has proven to be essential in helping companies boost their productivity on massive scales. With that said, Power BI helps manage all facets of a company, be it logistics or human resources or customer relations, in a rather seamless manner. If that term did not ring a bell, this blog will help you understand what is Power BI and what is Power BI used for.
Before we understand Power BI and its various verticals, let us learn what is BI. (Keep reading till the end to find answers to some of the most frequently asked questions on Power BI.)
BI or Business Intelligence is a technology-driven method. It helps analyze data and provides actionable information that helps corporate executives, business managers, and others make informed business decisions. Basically, BI is a set of concepts, systems, and technology that converts raw data into useful information. It is a suite of software and services that helps transform data into actionable intelligence and knowledge.
Speaking of its influence, BI directly impacts an organization’s strategic, tactical and operational business decisions. It supports fact-based decision-making by using historical data instead of assumptions and gut feelings. BI tools perform data analysis and create reports, dashboards, maps, graphs and charts to provide detailed intelligence to users about the nature of the business.
For the functioning of an organization, business intelligence plays a vital role in its operations as well as development as it helps
Now that we have learned what a business intelligence system is, let us learn what Power BI is.

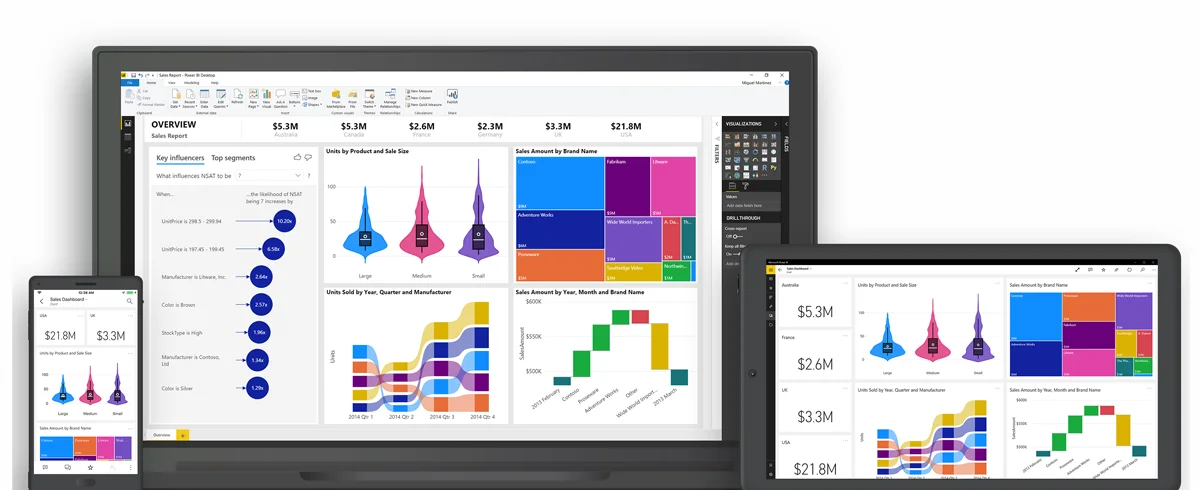
Power BI is an interactive data visualization software product that primarily focuses on business intelligence. It is a part of the Microsoft Power Platform. Power BI is basically a collection of software services, apps, and connectors that work together to convert unrelated sources of data into coherent, visually immersive and interactive insights. In such cases, data may be input by reading directly from a database, webpage, or structured files such as spreadsheets, CSV, XML and JSON.
Power BI is a business intelligence platform that provides non-technical business users with tools for aggregating, analyzing, visualizing, and sharing data. For users familiar with Microsoft Excel, it offers a fairly intuitive user interface. Moreover, its integration with other Microsoft products makes it a versatile self-service tool that only requires a little training upfront.
In other words, Power BI is a business intelligence and data visualization tool that is mostly used for converting data from various other data sources into interactive dashboards and analysis reports. It also offers cloud-based services for interactive visualizations with a simple interface for end-users to help them create their own reports and dashboards.
There are various versions of the Power BI available. These include desktop, service-based (SaaS) and mobile Power BI apps that are used for different platforms. The tool provides multiple software connectors and services for business intelligence purposes.
“Connect to and visualize any data using the unified, scalable platform for self-service and enterprise business intelligence (BI) that’s easy to use and helps you gain deeper data insight.” – Microsoft
To summarize it, you can connect with the following data sources using Power BI connectors:
The data is processed and transformed with Power BI queries to the apparent data model. The data objects required to be a part of a Power BI report are created in the form of measures, calculated columns and parameters. So, how was Power BI developed?
The Microsoft Power BI was originally created by Theirry D’Hers and Amir Netz of the SQL Server Reporting Services Team at Microsoft. It was originally designed by Ron George in the summer of 2010 under a project named ‘Project Crescent’ that was initially available for download in 2011. Moreover, it was initially bundled with SQL Server Codename Denali.
In 2013, it was renamed ‘Power BI’ and was later unveiled by Microsoft in Office 365. Its first release was based on the Microsoft Excel-based add-ins, which included Power Query, Power Pivot and Power View. Over time, Microsoft added various additional features such as Questions and Answers, enterprise-level data connectivity and security options via Power BI Gateways.
In 2015, the Power BI was first unveiled in front of the general public. Later in the same year, Microsoft announced that it had acquired the Canadian company, Datazen, to “complement our Power BI, our cloud-based business analytics service, rounding out our mobile capabilities for customers who need a mobile BI solution implemented on-premises and optimized for SQL Server.” In fact, most of the visuals in Power BI started life as Datazen visuals.
Further, in February of 2019, Gartner.com confirmed Microsoft as a leader in its ‘2019 Gartner Magic Quadrant for Analytics and Business Intelligence Platform’ due to the capabilities of the Power BI platform. The achievement emerged as the 12th consecutive year of recognition of Microsoft as a leading vendor in the Magic Quadrant category (3 years prior to the creation of Power BI).
Microsoft’s Power BI is primarily used to find insights into an organization’s data. The tool can help connect disparate data sets, transform and clean the data into a data model and further create charts or graphs to provide visuals of the data. All of these aspects can be shared with other Power BI users within the organization.
The data models created using Power BI can be used in various ways for organizations. These include narrating stories through charts and data visualizations, examining questionable scenarios within the data, and many more. The reports generated can answer questions in real-time and help with forecasting to ensure departments fulfill their business metrics.
Additionally, Power BI also offers executive dashboards for administrators and/or managers. As a result, it helps the management to provide more insights into how departments are functioning.
Although Power BI is a self-service BI tool that delivers data analytics to employees, it is mostly used by data analysts and business intelligence professionals who create the data models before disseminating reports throughout the organization. However, users who do not hail from an analytical background can still navigate Power BI and create reports. The tool is used by department representatives and management, with reports and forecasts created to aid sales and marketing reps. Meanwhile, it also provides data for management on how the department or individual employees are progressing toward their goals. Additionally, the Power BI provides an admin portal for administrators to help configure its implementation as well as its usage monitoring and licenses.
To summarize its usage and importance, Power BI helps in the below-mentioned aspects:
Since its release, Microsoft has added a plethora of data analytics features to the Power BI. To date, the tech firm continues to do so. However, some of the most important features of Power BI include:

There are several versions of Power BI available to choose from—depending on your budget, needs, and how you want to deploy it. These versions range from light use to comprehensive features, from free to premium, allowing users to choose the one that best meets their needs.
While Power BI Desktop is a Windows desktop application, the Power BI service is an online SaaS (Software as a Service) service. The Power BI app is available on iOS and Android phones and tablets. On the other hand, the Power BI Report Server is an on-premise version. Following are some of the available versions of Power BI and each version serves a different purpose.
The authoring tool of Power BI, the desktop component is mainly used by the report designers to access, transform and model the data while creating measures and building the data visualizations. Power BI Desktop can be downloaded for free and it supports Windows OS.
It is the cloud-based central hub of the Power BI solution where users can access and interact with their Power BI reports. Using this, users can also create dashboards from their reports and can use the self-service functions for editing and creating new visualizations. Users can further share the concluded insights and collaborate with co-workers on reports and dashboards. There are two ways to license Power BI Service; Power BI Pro and Power BI Premium.
Power BI’s mobile component allows users to interact with their published reports through smartphones or tablets via a downloadable app. The Power BI Mobile provides access to reports on the fly at anywhere and at any point in time. Users can also personalize data alerts and get real-time data updates using the mobile component of Power BI. The component is supported by Windows, iOS as well as Android devices.
Report Server is a server product that comes with the Power BI Premium. It enables users to use Power BI on-premise. For some businesses, uploading data to the cloud is not a feasible option due to data regulation laws applied to their industry. It could also be due to a lack of infrastructure or connectivity where they are able to reliably access SaaS platforms.
Lastly, Power BI Embedded enables Independent Software Vendors (ISVs) and developers to embed Power BI’s functionality and capabilities into their respective apps on a pay-as-you-go or ‘white label’ basis. Instead of building their own reporting features, users can rather add Power BI to their products and it will cater to all the reporting necessary reporting and data analysis.
The above-listed are the different versions of the Power BI available. Let us now have a look at the components of Power BI.
The Power BI product is made up of a number of apps. Each has its own respective features and uses. The following are the components of Power BI:
Now that we have understood the various components of Power BI, let us have a look at how to create a Power BI dashboard.
You can create a Power BI dashboard using the following steps:
Using the following steps, you can create a Power BI dashboard. There are several examples of Power BI dashboard available on the internet that you can refer for your convenience.

1. Does Power BI Support Mobile Devices?
Yes, it does. Power BI has a mobile version. Power BI enables users to consume data at any given point in time using their mobile or tablet. This also enables you quick and easy access to your data during times of necessity. In fact, they also allow you to connect to your data, make insights, collaborate on the go, and get notified of changes in data. You can also consume data using the Power BI mobile apps. However, you can neither create nor edit reports.
2. Who Are Power BI’s Main Competitors?
Although Power BI is one of the leading and most popular business analytics platforms on the market currently, the tool has some major competition from its alternatives as well as competitors. The tool uses state-of-the-art interactive visualizations, combined with industry-leading data queries and modeling built-in. However, the main competitors of Microsoft Power BI are:
Tableau Desktop allows people to make data-driven decisions by helping them answer questions quickly, solve tough problems easily and discover new insights more frequently. It directly connects to hundreds of data sources—both on-premises or in the cloud—and makes it easier to commence the analysis.
Other notable competitors of Power BI are Google Data Studio, Amazon QuickSight, IBM Cognos, Elasticsearch, SAS Visual Analytics, Jet Reports, TIBCO Spotfire, and MicroStrategy Analytics.
3. What Are the System Requirements for Power BI?
In order to incorporate Power BI, there are certain minimum requirements that you would need to fulfill to run Power BI Desktop
Sign up to receive our newsletter featuring the latest tech trends, in-depth articles, and exclusive insights. Stay ahead of the curve!